

Wipro Share Price: Wipro Ltd. remains one of the most closely watched counters among India’s major IT giants. As market sentiment continues to shift dynamically across the technology sector, retail and institutional investors increasingly track Wipro share price trends on the National Stock Exchange (NSE).
Furthermore, whether you are tracking Wipro’s recent trajectory, analyzing its valuation fundamentals, or evaluating its past corporate actions, such as the major ₹15,000 crore buyback, this article provides a comprehensive, data-driven breakdown of the key factors driving the stock.
To stay updated on the latest price movements and market developments, you can explore the following financial platforms:
- Check real-time quotes: Money control Wipro Page
- View official exchange listings: BSE India Wipro Page
- Access analysis and financials: Finology Ticker
Additionally, to better understand Wipro share price or Wipro’s current market position, consider the following key stock metrics:
- Current Price: ₹158.38
- Day Range: ₹158.38–₹162.21
- 52-Week Range: ₹156.79–₹273.10
- Market Capitalization: Approximately ₹1,56,875 crore
- Next Earnings Date: October 14–15, 2026 (Q2 FY 2026–27)
Overall, by monitoring these metrics of Wipro Share Price alongside market developments and financial results, investors can gain a clearer understanding of Wipro’s stock performance. Consequently, they can make more informed assessments of its valuation and potential investment opportunities.
YOU CAN STOP READING FOR NOW BUT IF YOU WANNA DIVE FURTHER ABOUT WIPRO SHARE PRICE KEEP READING👍
1. Current Market Standing & NSE Performance
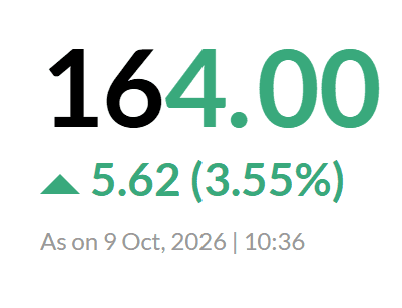
Trading under the ticker Wipro share price on the NSE, the stock has experienced notable volatility over the past year.
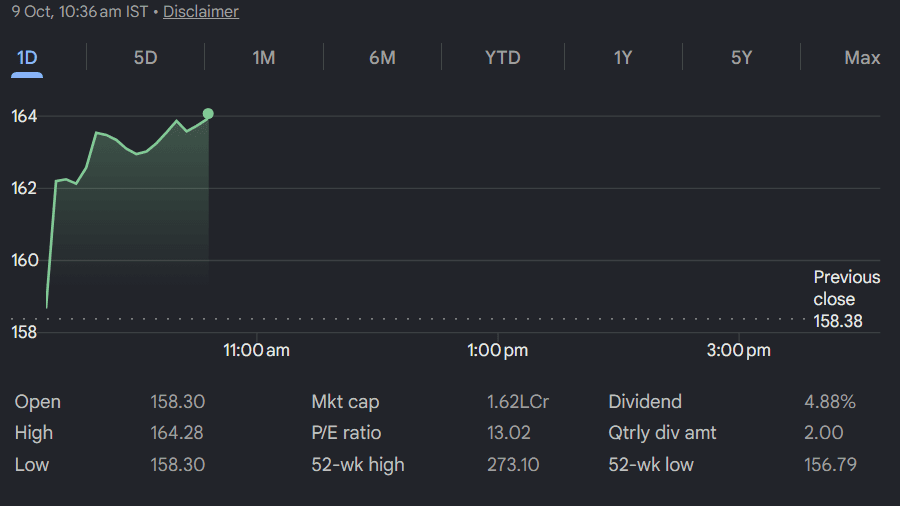
- 52-Week Range: The stock has traded between a low of ₹156.79 and a high of ₹273.10.
- Market Capitalization: Wipro maintains a massive large-cap presence, with a market capitalization ranging from approximately ₹1,59,400 crore to ₹1,61,400 crore.
- P/E Ratio & Valuation: The trailing twelve-month (TTM) P/E ratio hovers around 12.83, trading at a discount compared with the broader IT sector’s average P/E of roughly 20.20.
Before projecting future price targets, investors should understand Wipro’s core financial health by examining its latest reported financial figures.
| Financial Metric | Value / Range | What It Means |
|---|---|---|
| Book Value Per Share | ₹92.13 | Represents the net asset value backing each share. |
| Earnings Per Share (EPS) | ~₹12.56 | Measures the core profitability generated per outstanding share. |
| Dividend Yield | ~5.00% | Offers a potentially attractive source of regular income for long-term shareholders. |
| Debt-to-Equity | 0.22 (approximately 19%) | Indicates relatively low financial leverage and a balance sheet with limited debt exposure. |
Over the past decade, Wipro has routinely used tender-offer buybacks to return cash to shareholders. The landmark ₹15,000 crore buyback initiative set a tender price of ₹250 per share, offering a substantial premium over the prevailing open-market prices at the time.
Why Buybacks Matter? Buybacks reduce the number of outstanding shares, potentially supporting earnings per share (EPS) growth and improving shareholder value when business growth accelerates.
4. What Analysts and Technical Indicators Say
Technical charts and market sentiment indicators provide different perspectives for short-term traders and long-term investors.
- Moving Averages: Short-term moving averages, such as the 5-day and 10-day lines, reflect recent consolidation near support zones. Meanwhile, higher moving-average bands indicate potential areas of immediate resistance.
- Support Levels: Technical chart watchers identify historical buyer-defense zones around the ₹156–₹160 threshold.
- Analyst Sentiment: Market consensus leans cautious or neutral in the short term because global macroeconomic headwinds continue to affect technology spending. However, long-term value investors may view Wipro’s relatively high dividend yield and low valuation multiples as an attractive accumulation opportunity.
Frequently Asked Questions (FAQs)
What is the all-time high for Wipro share price?
Wipro’s historical peak has varied depending on corporate actions, including bonus issues, and different market cycles. More recently, the stock’s 52-week high reached ₹273.10 before macroeconomic pressures triggered corrections across the IT sector.
Is Wipro a good stock for dividends?
Wipro may appeal to income-focused investors because its dividend yield has averaged around 5.00% according to the figures cited above. However, investors should verify the latest dividend announcements and market price before assessing its current yield.
Disclaimer: This article is for informational and educational purposes only and does not constitute financial or investment advice. Always conduct your own research or consult a certified financial advisor before investing in the stock market.
Still have problems in filling Govt Exam Application? Check this
Written by: Suresh Kumar
Reviewed by: Nokari Editorial Team (Divyesh)
Published: 9 October 2026
Last Updated: 9 October 2026
About the Author




1 thought on “Wipro Share Price Today: Check Live Updates Now”